

prometheus安装和oracle告警配置
一、安装Prometheus
通过git下载新版本promethus
mv prometheus-2.40.1.linux-amd64.tar.gz /usr/local/
cd /usr/local
tar zxvf prometheus-2.40.1.linux-amd64.tar.gz
cd /usr/local/prometheus-2.40.1.linux-amd64
vim prometheus.ymlglobal:scrape_interval: 15s # Set the scrape interval to every 15 seconds. Default is every 1 minute.evaluation_interval: 15s # Evaluate rules every 15 seconds. The default is every 1 minute.# scrape_timeout is set to the global default (10s).# Alertmanager configuration
alerting:alertmanagers:- static_configs:- targets:# - alertmanager:9093# Load rules once and periodically evaluate them according to the global 'evaluation_interval'.
rule_files:# - "first_rules.yml"# - "second_rules.yml"# A scrape configuration containing exactly one endpoint to scrape:
# Here it's Prometheus itself.
scrape_configs:# The job name is added as a label `job=` to any timeseries scraped from this config.- job_name: "prometheus"# metrics_path defaults to '/metrics'# scheme defaults to 'http'.static_configs:- targets: ["localhost:9090"]
启动方式:
nohup ./prometheus &访问 http://ip:9090
二、配置邮件告警
1、下载邮件模块
Tags · prometheus/alertmanager · GitHub
tar zxvf alertmanager-0.24.0.linux-amd64.tar.gz
mv alertmanager-0.24.0.linux-amd64 /usr/local/
cd /usr/local/alertmanager-0.24.0.linux-amd64
2、修改配置
vim alertmanager.yml这里以163邮件为准
global:resolve_timeout: 5m###################################smtp_auth_username: "********@163.com"smtp_auth_password: "********"#smtp_auth_secret: "********"smtp_require_tls: falsesmtp_smarthost: "smtp.163.com:25"smtp_from: "********@163.com"####################################
route:group_by: ['alertname']group_wait: 10sgroup_interval: 10srepeat_interval: 1hreceiver: 'email'receivers:
- name: 'email'email_configs:- send_resolved: trueto: '********@qq.com'
inhibit_rules:- source_match:severity: 'critical'target_match:severity: 'warning'equal: ['alertname', 'dev', 'instance']
如果需要添加多人告警则receivers的to后面添加邮箱地址:
receivers:
- name: 'email'email_configs:- send_resolved: trueto: '********@qq.com,*****@163.com'
3、启动alertmanager告警模块
nohup ./alertmanager &检查告警模块配置文件是否正常
./amtool check-config alertmanager.yml
启动后看到的界面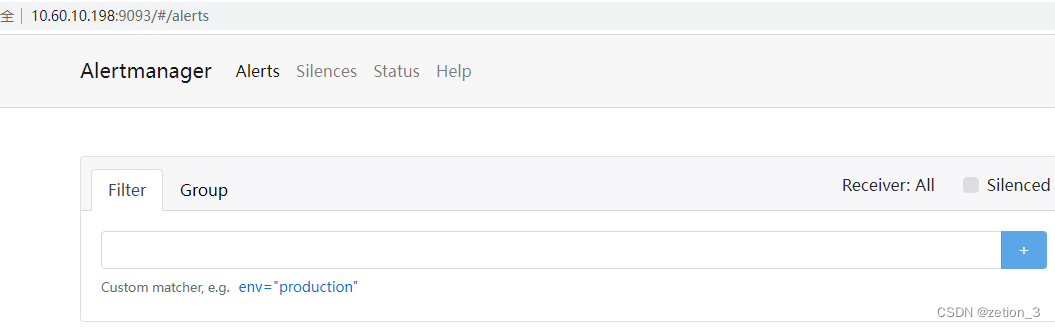
4、集合到prometheus
修改以下一行即可
这里的10.60.10.198改为对应alertmanager的模块地址重启prometheus即可
# Alertmanager configuration
alerting:alertmanagers:- static_configs:- targets:- 10.60.10.198:9093
三、监控Oracle
下载oracle_exporter
Tags · iamseth/oracledb_exporter · GitHub
1 、安装
tar zxvf oracledb_exporter.0.3.0rc1-ora18.5.linux-amd64.tar.gz
mv oracledb_exporter.0.3.0rc1-ora18.5.linux-amd64 /usr/local
2、配置添加oracle参数
这里就是要监控的数据库实例的用户名和密码
su - oracle
vim ~/.bah_profile
# oracledb_exporter
export DATA_SOURCE_NAME=oratest/oratest
export LD_LIBRARY_PATH=$ORACLE_HOME/lib
启动的时候正常会报一个 libclntsh.so.18.1缺失的报错(这里要注意针对自己环境的ORACLE_HOME路径去做这个软链接)
ln -s /u01/app/oracle/product/11.2.0/db_1/lib/libclntsh.so.11.1 /u01/app/oracle/product/11.2.0/db_1/lib/libclntsh.so.18.1
3、启动oracle监控
cd /usr/local/oracledb_exporter.0.3.0rc1-ora18.5.linux-amd64
nohup ./oracledb_exporter &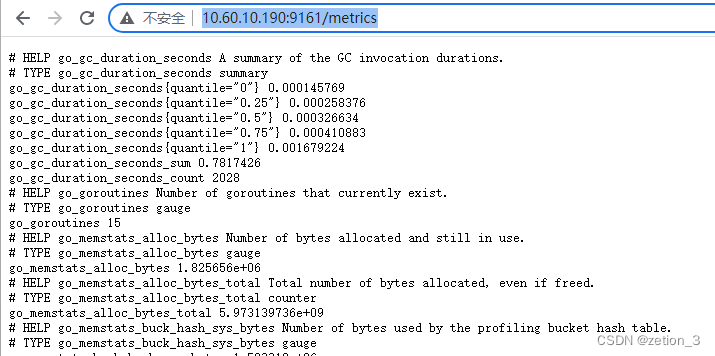
4、结合到Prometheus
在prometheus.yml最后增加以下内容,重启Prometheus即可(IP即Oracle数据库的IP)
######################## Oracle监控 ##########################- job_name: 'oracle'metrics_path: '/metrics'static_configs:- targets: ['10.60.10.190:9161']四、配置告警
修改Prometheus配置文件启用rule_files(这个在默认配置里面有该配置没有的话加到alertmanagers后面即可)配置完成重启prometheus进程
rule_files:- "first_rules.yml"
配置oracle实例监控进程
这里有个关键字oracledb_up 1
我们通过监控这个关键字来确认数据库实例是否启动
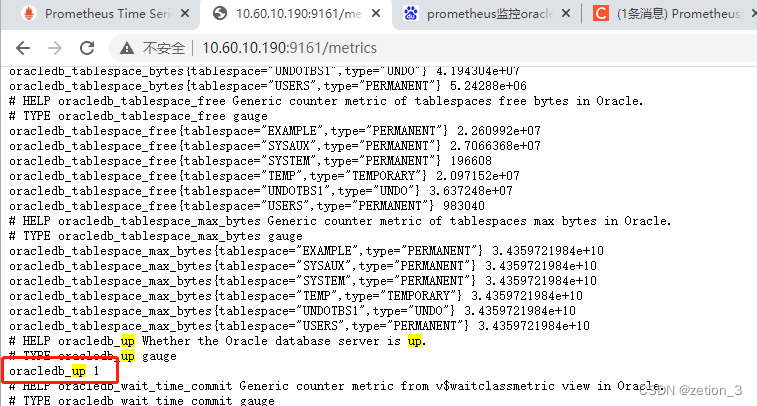
配置启用的rule文件
cd /usr/local/prometheus-2.40.1.linux-amd64
vim first_rules.ymlgroups:- name: node-alertrules:- alert: Oracle Statusexpr: oracledb_up == 0for: 5slabels:severity: warningannotations:summary: "{{$labels.instance}}: Oracle has stop "description: "数据库挂了,请检查"
重启Prometheus
在Alerts下出现一个oracle status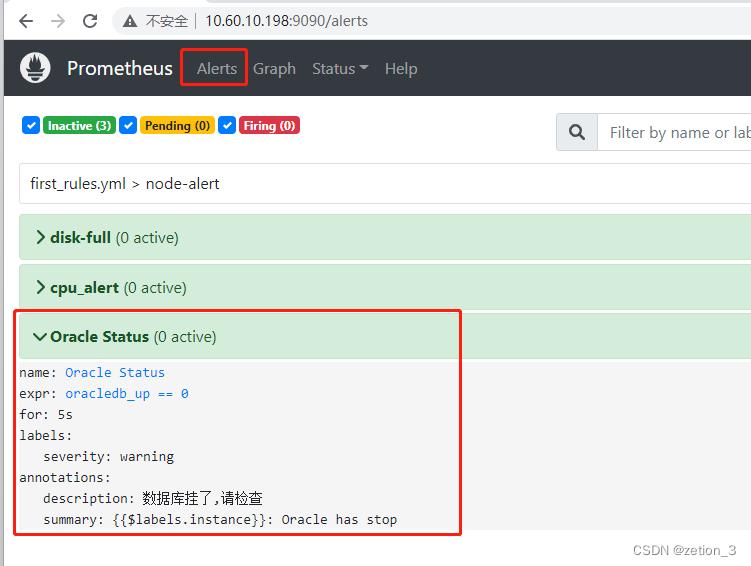
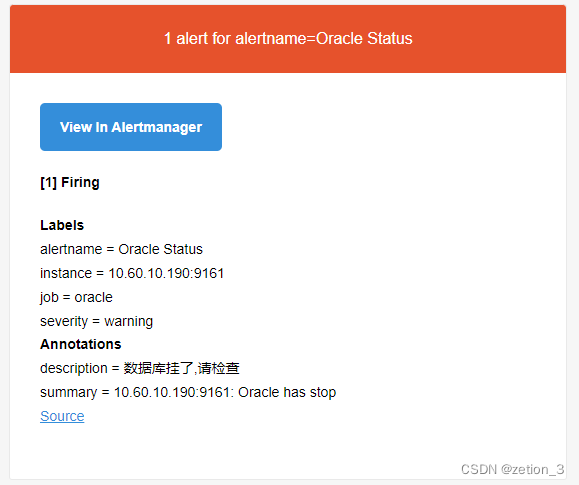
自此完成配置监控。用sqlplus关闭实例后触发告警如下
END:
写在最后,遇到出错的地方记录
1、oracle缺失lib那个,上门做软连接解决
2、邮件告警发送错误,这个在alertmanager下的nohup.out能看到报错(特别注意163邮件端口号是25刚开始我用465和587都是报错如果QQ邮箱自测)
另外有个是因为我mail_from地址错误了导致一直不能发送。
上一篇:童年是什么样的?模仿20个句子
下一篇:惊了!10万字的Spark全文!