

性能测试-CPU性能分析,用户态us高,初步定位到代码行
监控工具安装
Grafana:安装请看我上一篇文章性能测试-JMeter influxdb grafana性能测试监控平台-食用指南_Tommy.IT的博客-CSDN博客JMeter测试脚本跑起来,在influxdb服务看看数据里面的数据,原来influxdb的jmeter库里面没有表,当JMeter脚本运行的时候,influxdb会自动创建好表并有数据写入。grafana influxdb模板id:5496,可以下载为json,在grafana里面再导入也可以。成功打开grafana首页,提示一下如果进入不了,要关闭linux的防火墙。添加模板页面:数据库名称:influxdb,其他默认,点击import。measurements:jmeter,表的名字,默认。 https://blog.csdn.net/qq_30864373/article/details/127736953
node_exporter:Download | Prometheus
node_exporter-1.4.0.linux-amd64.tar.gz
在被监控的机器上面安装,多台服务器的话,就安装多个node_exporter,并启动完成
启动node_exporter:[root@centos7 node_exporter-1.4.0.linux-amd64]# nohup ./node_exporter &
[root@centos7 node_exporter-1.4.0.linux-amd64]# nohup node_exporter &
[1] 30117
[root@centos7 node_exporter-1.4.0.linux-amd64]# nohup: 忽略输入并把输出追加到"nohup.out"
nohup: 无法运行命令"node_exporter": 没有那个文件或目录
无法运行命令"node_exporter": 没有那个文件或目录:通常应该是有重复开启了,先查询一下ps -ef |grep node
prometheus:https://github.com/prometheus/prometheus/releases/download/v2.40.3/prometheus-2.40.3.linux-amd64.tar.gz
prometheus-2.40.3.linux-amd64.tar.gz ,解压后,需要修改prometheus.yml文件,修改的时候需要注意job_name与static_configs之间的缩进,不然会报错的!
yaml: unmarshal errors:\n line 30: field static_configs already set in type config.ScrapeConfig\n line 33: field static_configs already set in type config.ScrapeConfig
prometheus.yml文件修改如下,配置要监听的服务器地址,如果有多个服务器地址: - targets: ["l192.168.1.156:9100",192.168.1.157:9200]
static_configs:
- targets: ["localhost:9090"]
- job_name: "node"
static_configs:
- targets: ["192.168.1.156:9100"]
- job_name: "jvm"
static_configs:
- targets: ["192.168.1.156:3388"]
# my global config
global:scrape_interval: 15s # Set the scrape interval to every 15 seconds. Default is every 1 minute.evaluation_interval: 15s # Evaluate rules every 15 seconds. The default is every 1 minute.# scrape_timeout is set to the global default (10s).# Alertmanager configuration
alerting:alertmanagers:- static_configs:- targets:# - alertmanager:9093# Load rules once and periodically evaluate them according to the global 'evaluation_interval'.
rule_files:# - "first_rules.yml"# - "second_rules.yml"# A scrape configuration containing exactly one endpoint to scrape:
# Here it's Prometheus itself.
scrape_configs:# The job name is added as a label `job=` to any timeseries scraped from this config.- job_name: "prometheus"# metrics_path defaults to '/metrics'# scheme defaults to 'http'.static_configs:- targets: ["localhost:9090"]- job_name: "node"static_configs:- targets: ["192.168.1.156:9100"]- job_name: "jvm"  static_configs:- targets: ["192.168.1.156:3388"]
编辑完prometheus.yml后,启动prometheus,没有报错就可以了,用nohup ./prometheus & 后台启动
[root@centos7 prometheus-2.40.3.linux-amd64]# vim ./prometheus.yml
[root@centos7 prometheus-2.40.3.linux-amd64]# ./prometheus
ts=2022-11-27T18:14:06.505Z caller=main.go:512 level=info msg="No time or size retention was set so using the default time retention" duration=15d
ts=2022-11-27T18:14:06.505Z caller=main.go:556 level=info msg="Starting Prometheus Server" mode=server version="(version=2.40.3, branch=HEAD, revision=84e95d8cbc51b89f1a69b25dd239cae2a44cb6c1)"
ts=2022-11-27T18:14:06.505Z caller=main.go:561 level=info build_context="(go=go1.19.3, user=root@72aff466572b, date=20221124-09:08:44)"
ts=2022-11-27T18:14:06.505Z caller=main.go:562 level=info host_details="(Linux 3.10.0-1160.80.1.el7.x86_64 #1 SMP Tue Nov 8 15:48:59 UTC 2022 x86_64 centos7 (none))"
ts=2022-11-27T18:14:06.505Z caller=main.go:563 level=info fd_limits="(soft=4096, hard=4096)"
ts=2022-11-27T18:14:06.505Z caller=main.go:564 level=info vm_limits="(soft=unlimited, hard=unlimited)"
ts=2022-11-27T18:14:06.506Z caller=web.go:559 level=info component=web msg="Start listening for connections" address=0.0.0.0:9090
ts=2022-11-27T18:14:06.507Z caller=main.go:993 level=info msg="Starting TSDB ..."
ts=2022-11-27T18:14:06.509Z caller=head.go:562 level=info component=tsdb msg="Replaying on-disk memory mappable chunks if any"
ts=2022-11-27T18:14:06.509Z caller=head.go:606 level=info component=tsdb msg="On-disk memory mappable chunks replay completed" duration=4.645µs
ts=2022-11-27T18:14:06.509Z caller=head.go:612 level=info component=tsdb msg="Replaying WAL, this may take a while"
ts=2022-11-27T18:14:06.512Z caller=tls_config.go:232 level=info component=web msg="Listening on" address=[::]:9090
ts=2022-11-27T18:14:06.512Z caller=tls_config.go:235 level=info component=web msg="TLS is disabled." http2=false address=[::]:9090
ts=2022-11-27T18:14:06.513Z caller=head.go:683 level=info component=tsdb msg="WAL segment loaded" segment=0 maxSegment=1
ts=2022-11-27T18:14:06.514Z caller=head.go:683 level=info component=tsdb msg="WAL segment loaded" segment=1 maxSegment=1
ts=2022-11-27T18:14:06.514Z caller=head.go:720 level=info component=tsdb msg="WAL replay completed" checkpoint_replay_duration=14.183µs wal_replay_duration=4.687682ms wbl_replay_duration=121ns total_replay_duration=4.719326ms
ts=2022-11-27T18:14:06.515Z caller=main.go:1014 level=info fs_type=XFS_SUPER_MAGIC
ts=2022-11-27T18:14:06.515Z caller=main.go:1017 level=info msg="TSDB started"
ts=2022-11-27T18:14:06.515Z caller=main.go:1197 level=info msg="Loading configuration file" filename=prometheus.yml
ts=2022-11-27T18:14:06.519Z caller=main.go:1234 level=info msg="Completed loading of configuration file" filename=prometheus.yml totalDuration=3.68688ms db_storage=2.02µs remote_storage=2.83µs web_handler=189ns query_engine=433ns scrape=3.42652ms scrape_sd=33.153µs notify=16.474µs notify_sd=4.906µs rules=2.199µs tracing=10.114µs
ts=2022-11-27T18:14:06.519Z caller=main.go:978 level=info msg="Server is ready to receive web requests."
ts=2022-11-27T18:14:06.519Z caller=manager.go:944 level=info component="rule manager" msg="Starting rule manager..."
再重启以下grafana
[root@centos7 prometheus-2.40.3.linux-amd64]# systemctl restart grafana-servergrafana配置prometheus
选择prometheus数据源,以及配置好grafana服务地址
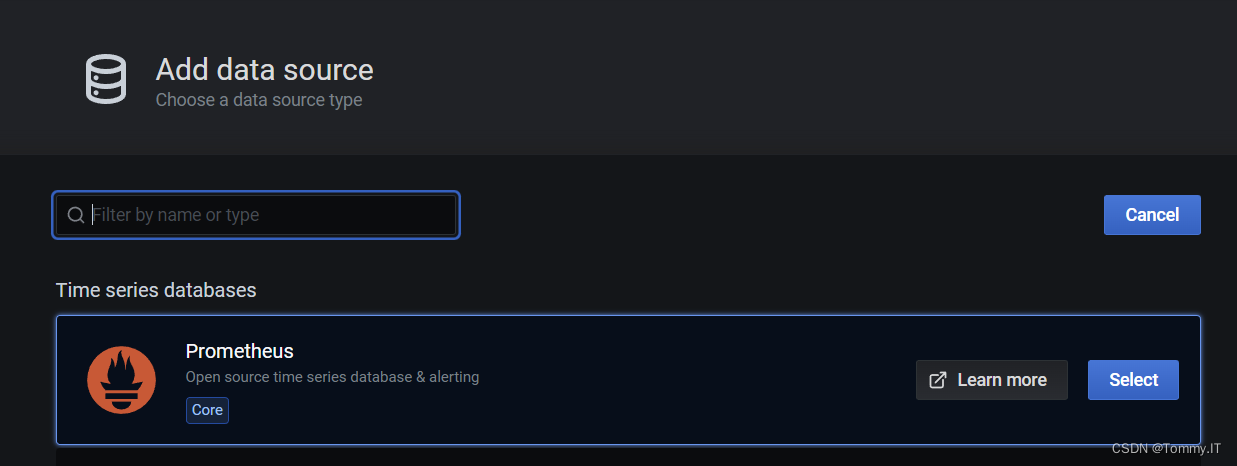
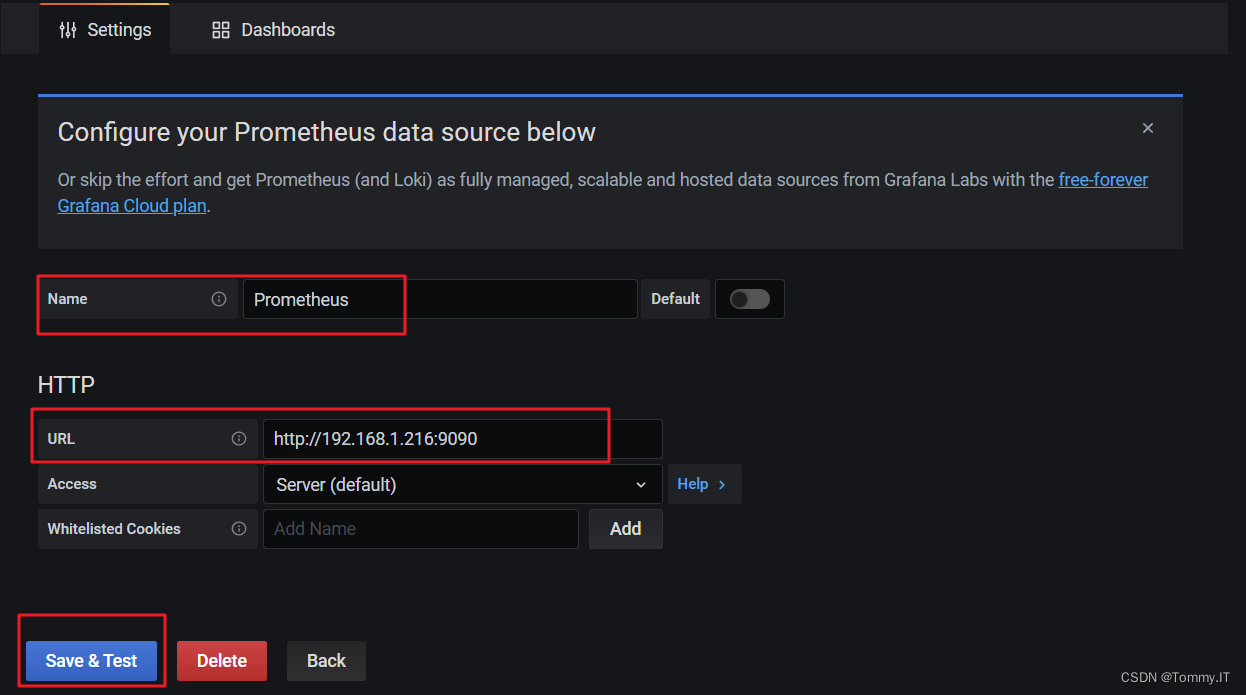
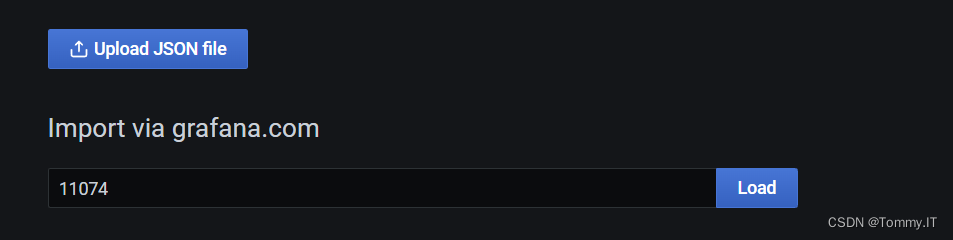
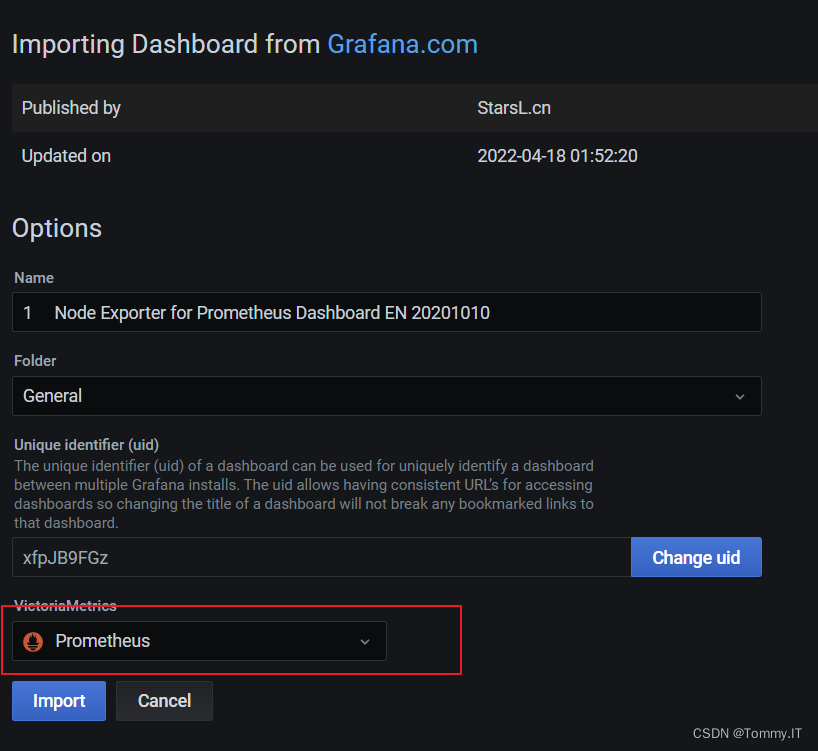
导入一个模板:11074
数据源prometheus
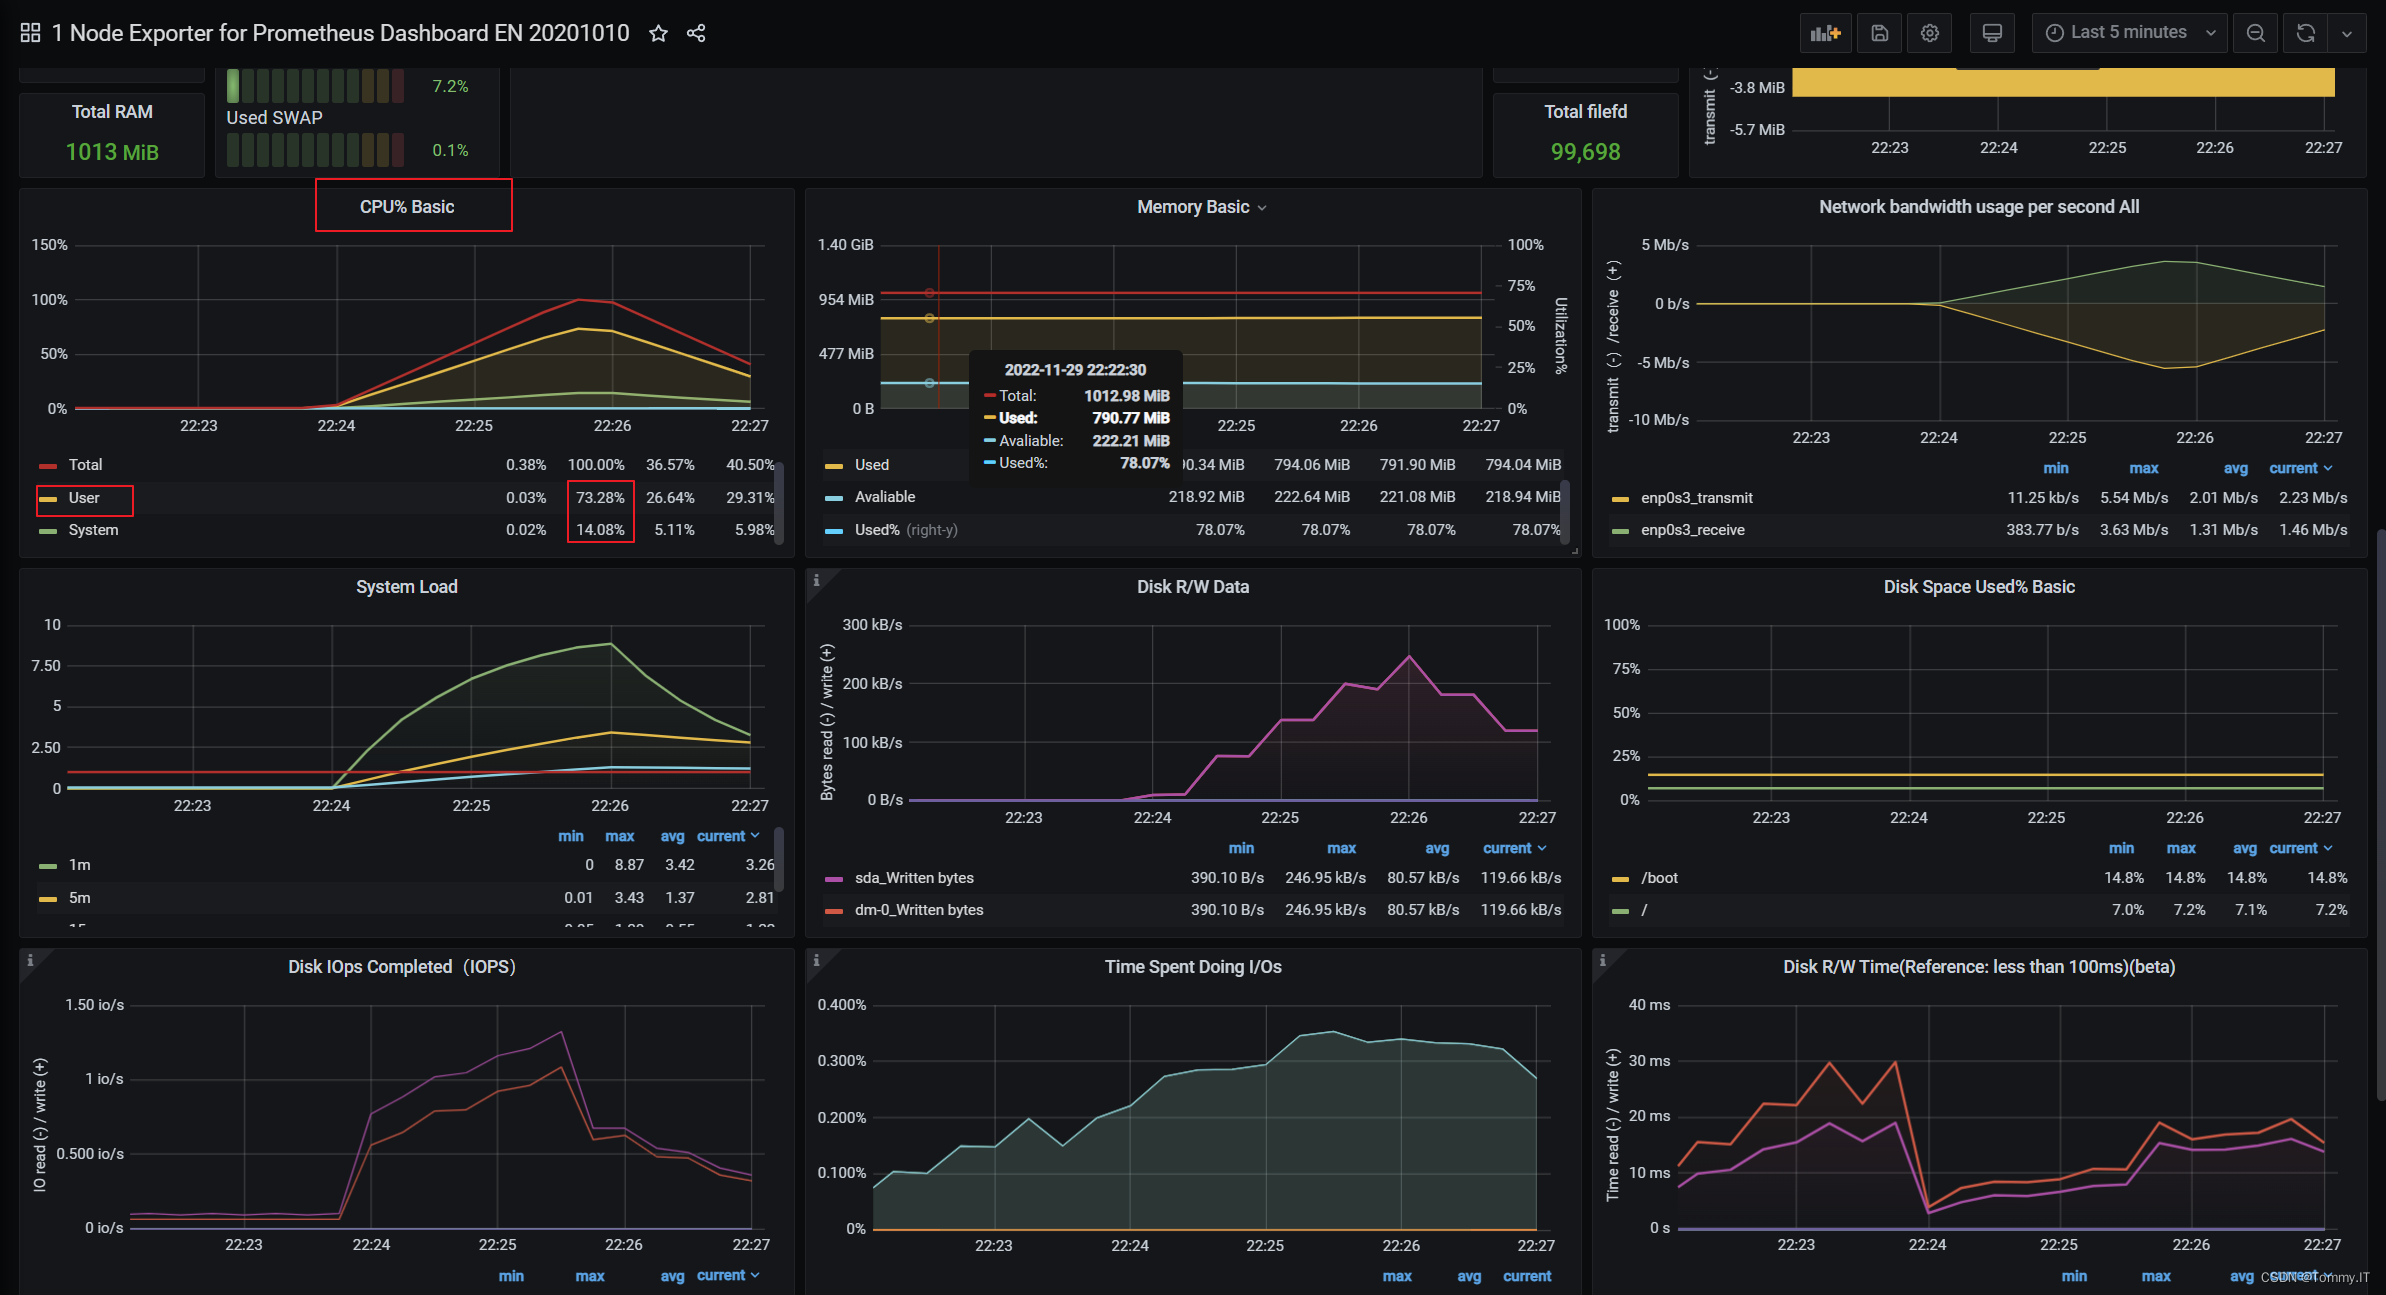
Grafana监控平台结果
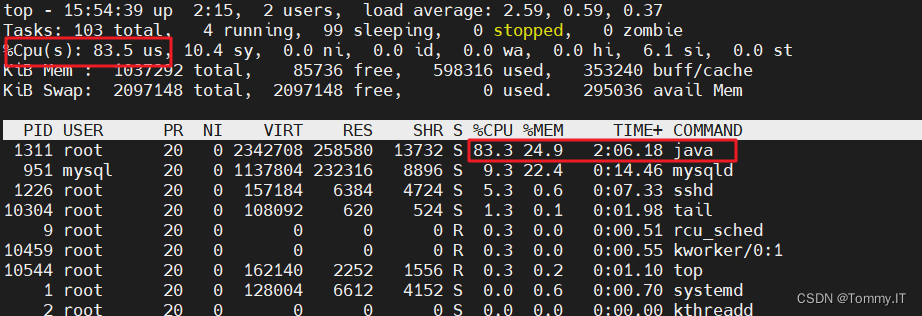
top:java进程的%CPU高,us用户态比sy系统态要高,所有java的us用户态导致,系统负载升高
Arthas-Alibaba 开源的 Java 诊断、性能分析工具
Arthas-安装
下载arthas-boot.jar,然后用java -jar的方式启动:
将arthas-boot.jar下载到指定文件夹中,并启动java -jar arthas-boot.jar,执行后会显示目前系统中的java项目有哪些,并以数字开头排序好,我们只需要输入对应项目的编号就可以了
curl -O https://arthas.aliyun.com/arthas-boot.jar
java -jar arthas-boot.jar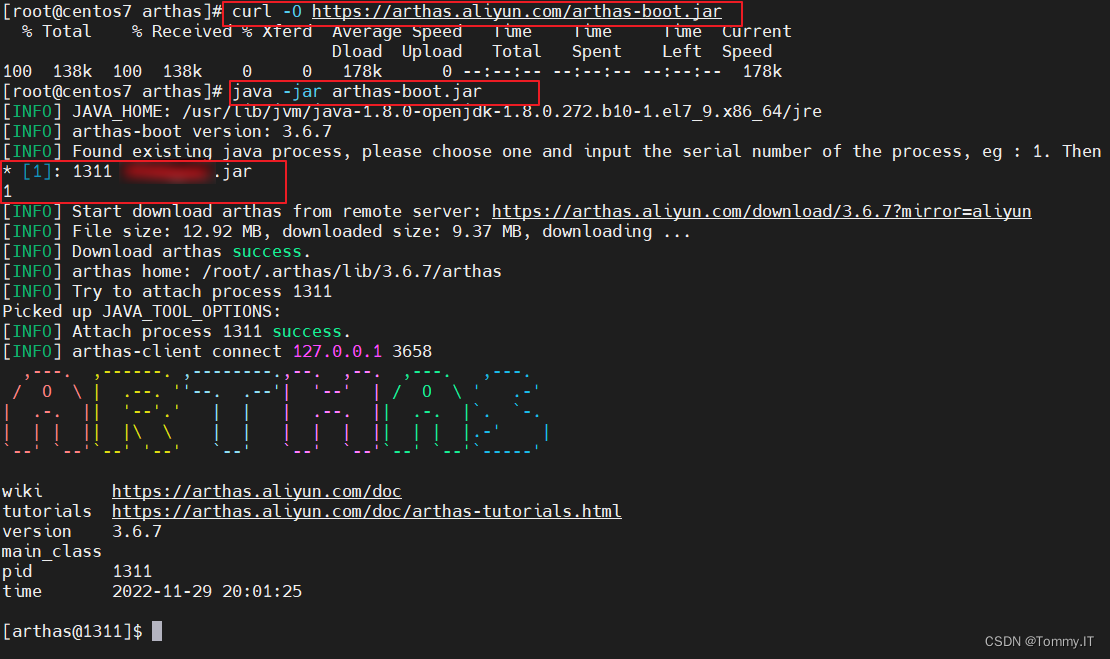
启动完成后,自动进入arthas监控工具,输入help回车,查看帮助文档
arthas-thread、heapdump
heapdump,Heap dump(堆)
thread --help,具体查看使用方法
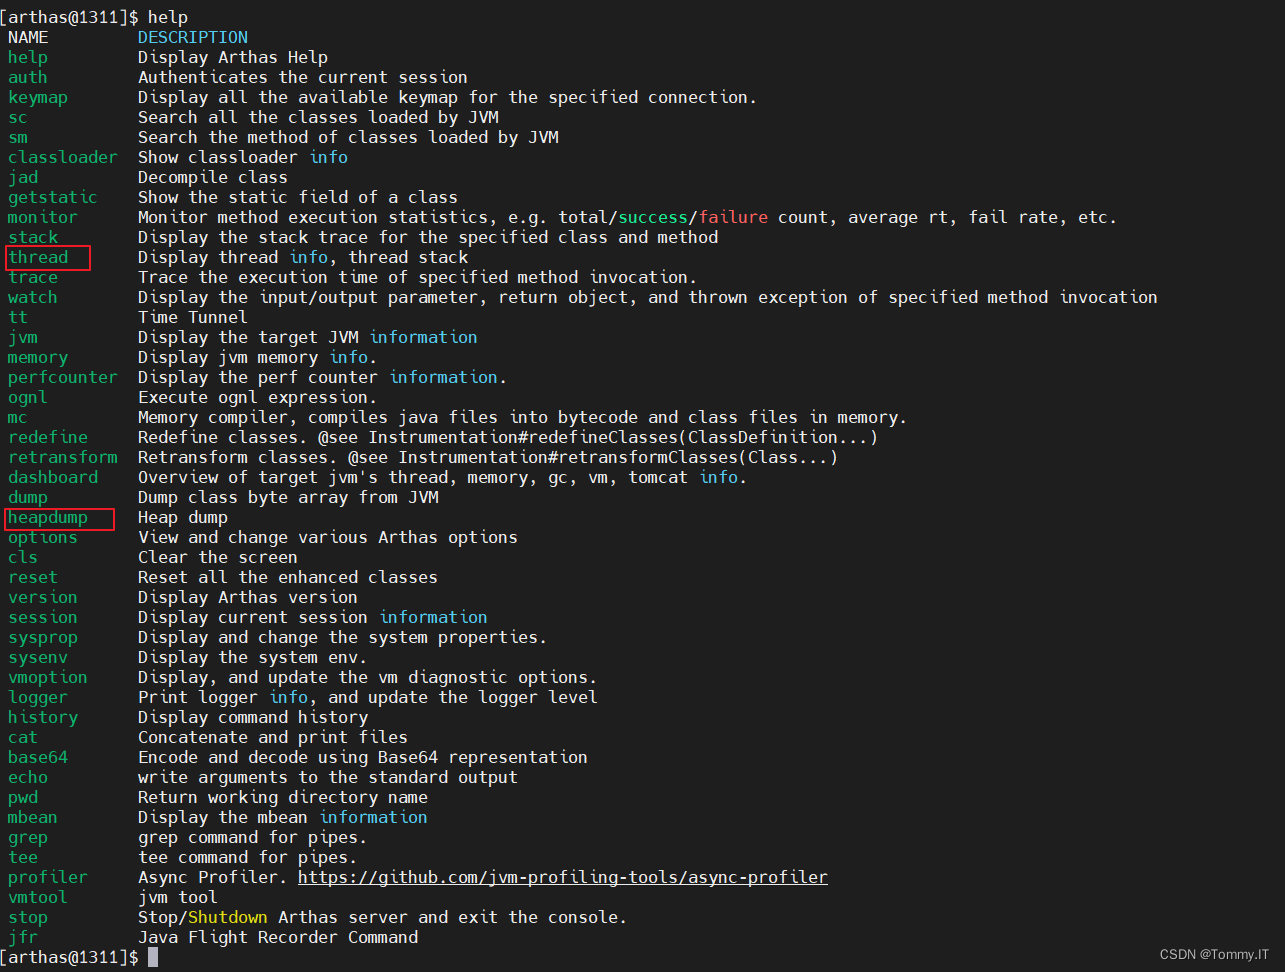
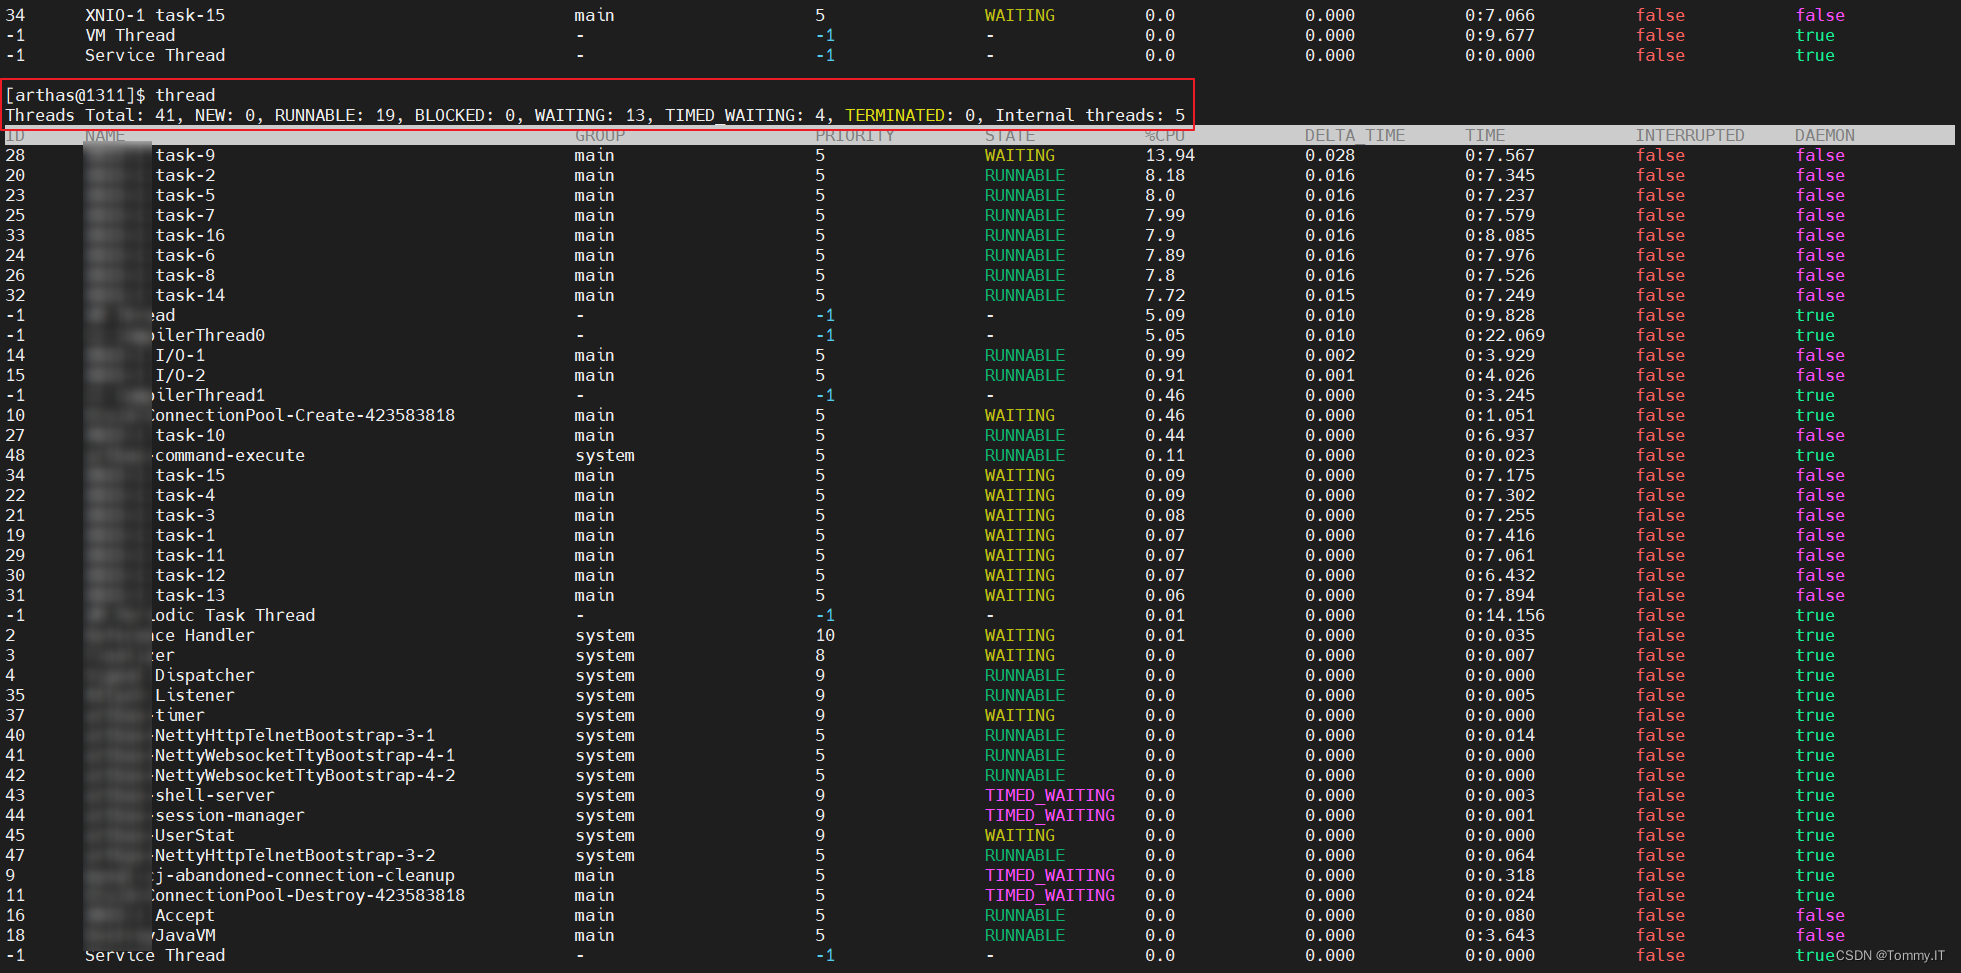
thread,线程,Display thread info, thread stack(栈
线程,程序里面真正干活的
线程栈,每个干活的线程具体的工作是什么
thread 显示所有线程
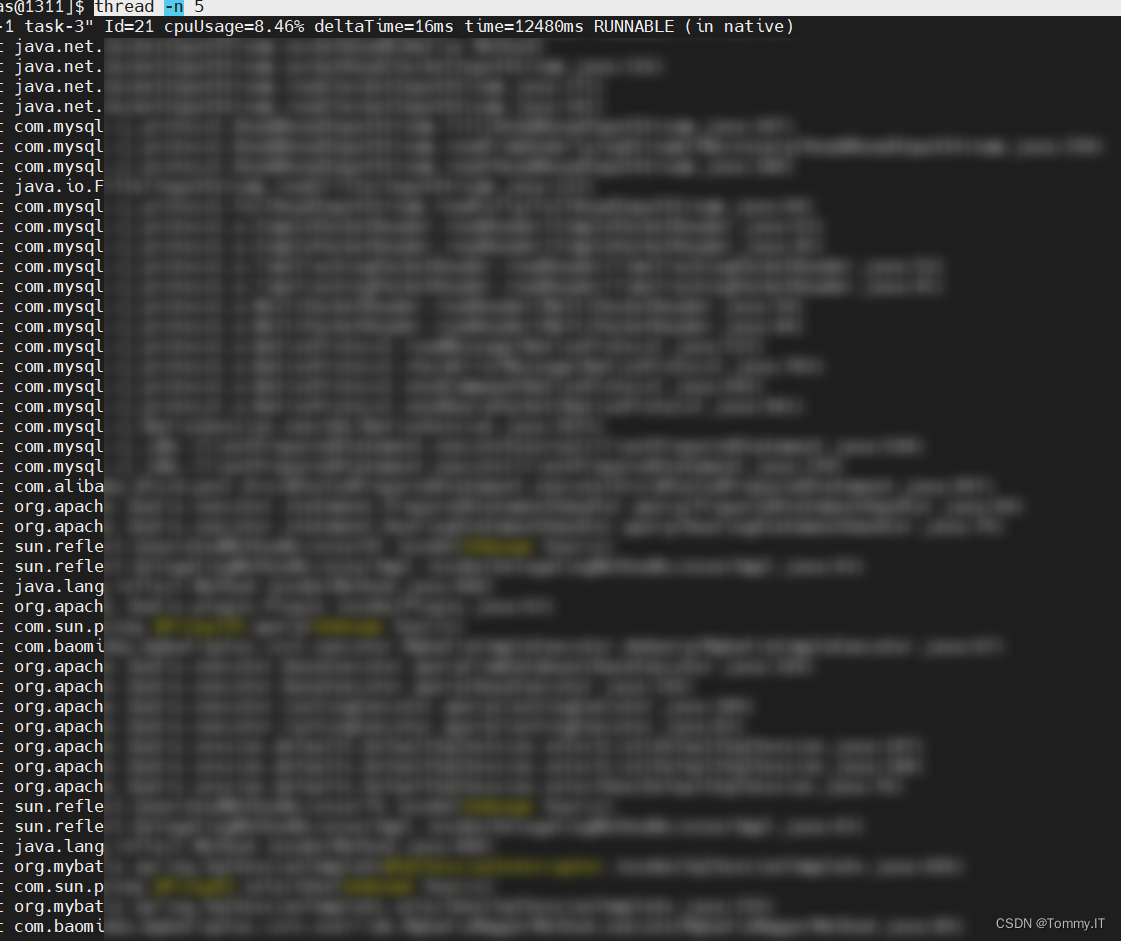
thread -n 5,,显示占用多资源的前5个线程和线程栈信息,发现有问题,UserController.java
上一篇:Day815.数据库参数设置优化 -Java 性能调优实战
下一篇:域自适应——Bidirectional Learning for Domain Adaptation of Semantic Segmentation