
docker-compose 安装 Prometheus + Grafana 配置监控页面
创始人
2024-04-11 04:14:32
安装 Prometheus + Grafana
docker 编排
prometheus:image: prom/prometheus:v2.40.1container_name: prometheusports:- "9090:9090"volumes:- /docker/prometheus/prometheus.yml:/etc/prometheus/prometheus.ymlnetwork_mode: "host"grafana:image: grafana/grafana:9.2.4container_name: grafanaenvironment:TZ: Asia/Shanghai# 服务地址 用于指定外网ip或域名GF_SERVER_ROOT_URL: ""# admin 管理员密码GF_SECURITY_ADMIN_PASSWORD: 123456ports:- "3000:3000"volumes:- /docker/grafana/grafana.ini:/etc/grafana/grafana.ini- /docker/grafana:/var/lib/grafananetwork_mode: "host"
配置文件编写
prometheus.yml
# my global config
global:scrape_interval:     15s # Set the scrape interval to every 15 seconds. Default is every 1 minute.evaluation_interval: 15s # Evaluate rules every 15 seconds. The default is every 1 minute.# scrape_timeout is set to the global default (10s).# A scrape configuration containing exactly one endpoint to scrape:
# Here it's Prometheus itself.
# 需要监控什么 在这里增加即可
scrape_configs:- job_name: 'Prometheus'static_configs:- targets: ['127.0.0.1:9090']- job_name: 'Grafana'static_configs:- targets: ['127.0.0.1:3000']
grafana.ini 官方默认配置 按需更改
内容过多 请查看下方附件
启动 Prometheus 与 Grafana
执行 docker 命令安装启动
docker-compose up -d prometheus grafana
查看 prometheus 控制台
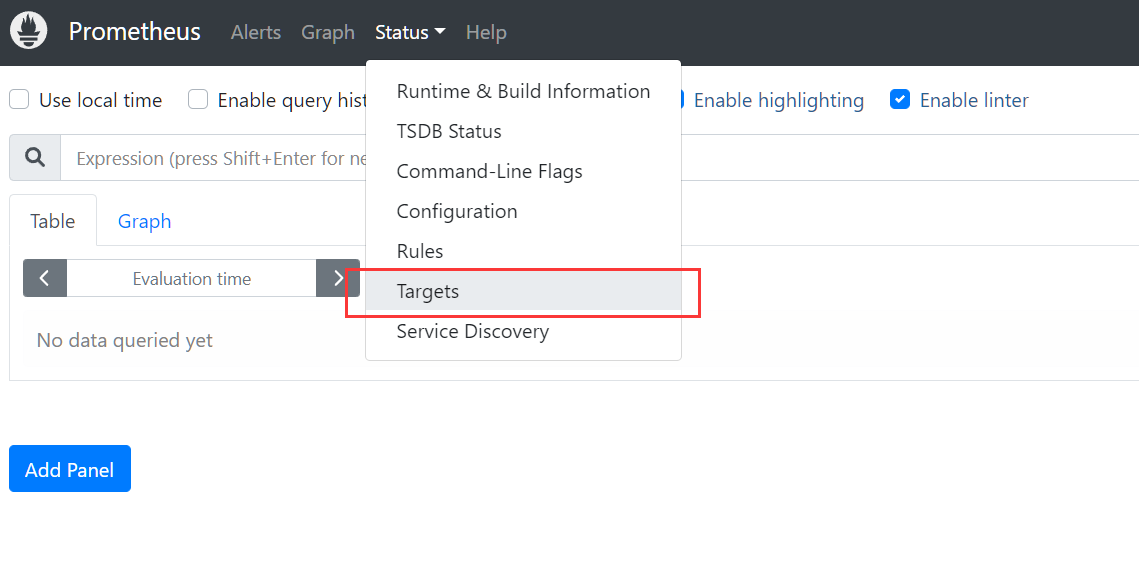
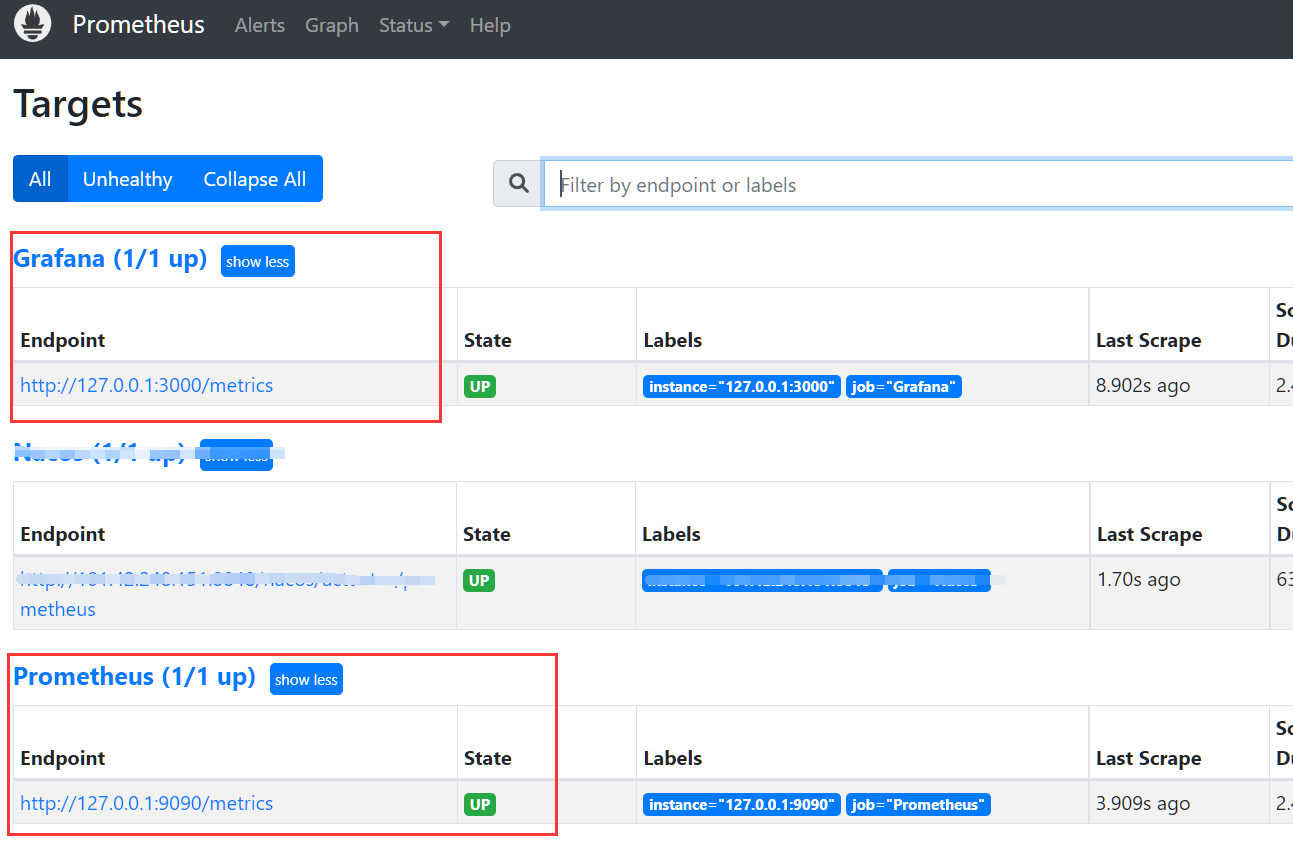
访问 9090 端口进入控制台 找到上方菜单 Status -> Targets
查看我们配置好的数据源节点采集状态
查看 Grafana 控制台
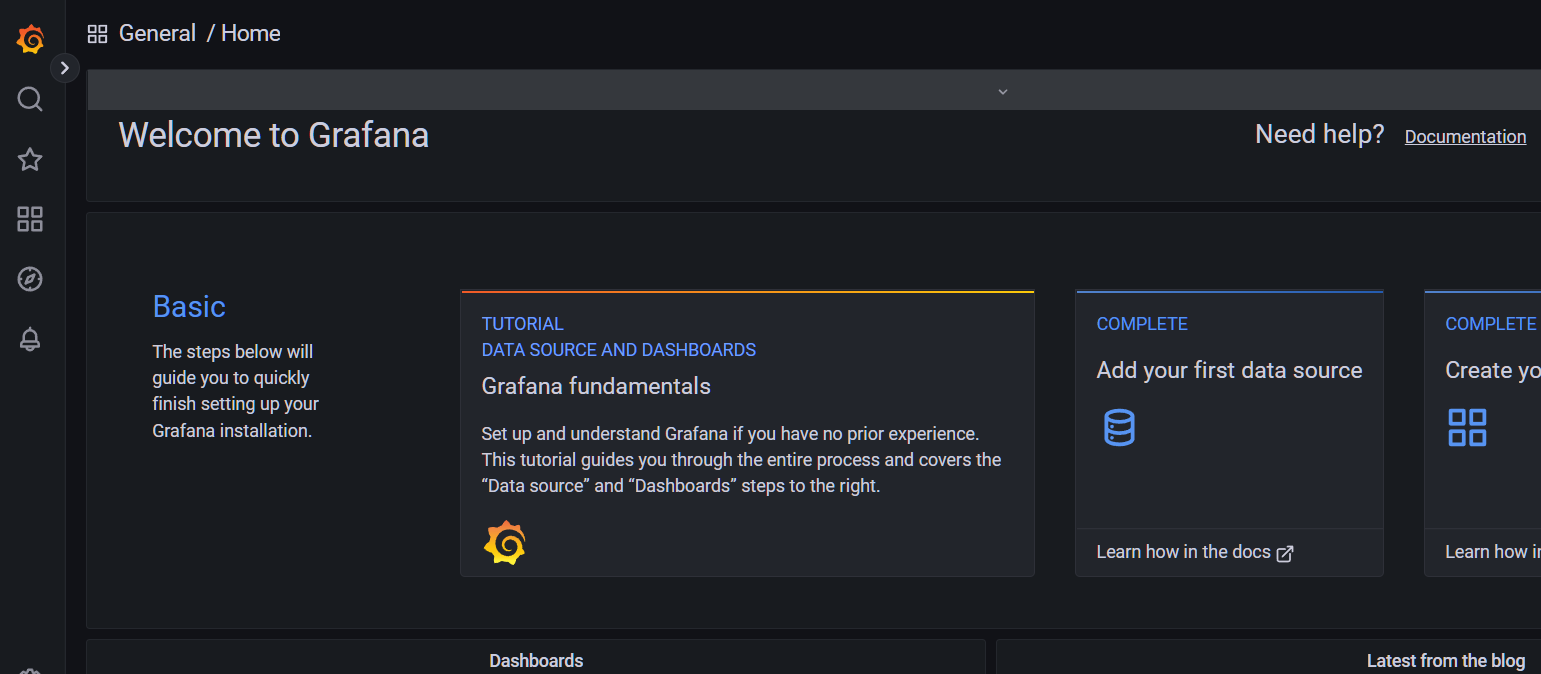
访问 3000 端口输入配置好的账号密码 进入控制台
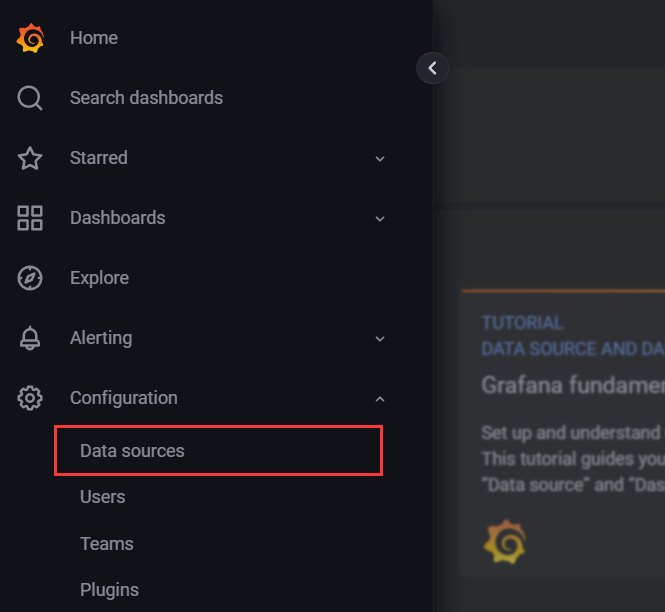
配置 prometheus 数据源采集
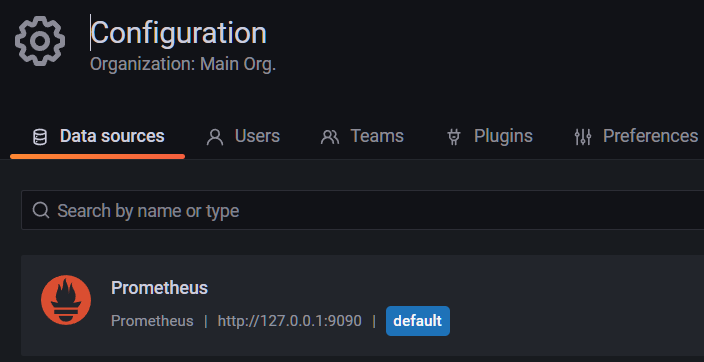
进入右侧菜单 Configuration -> Data Sources
点击右侧 Add data source
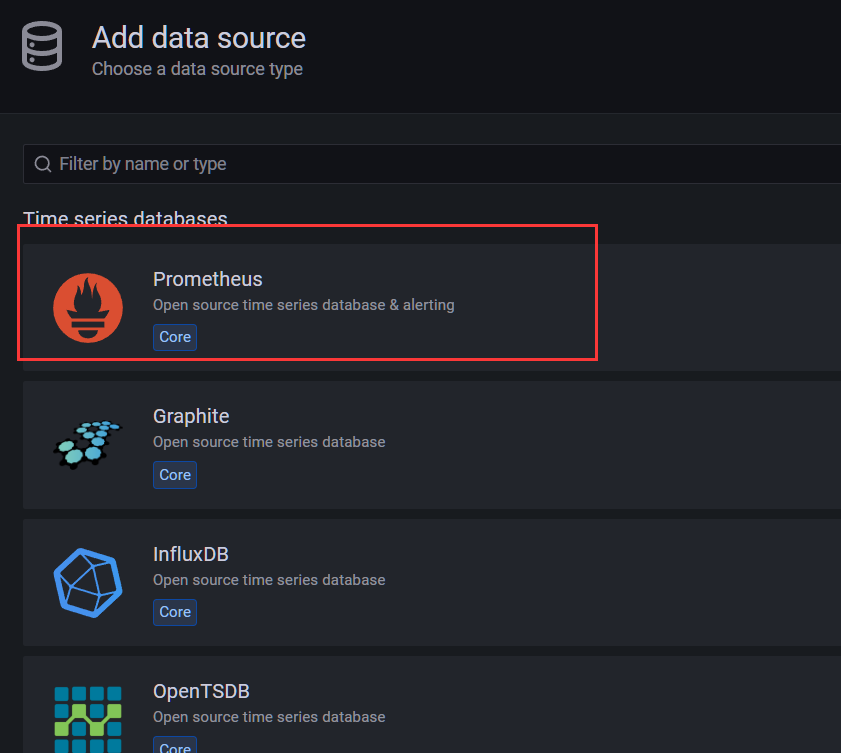
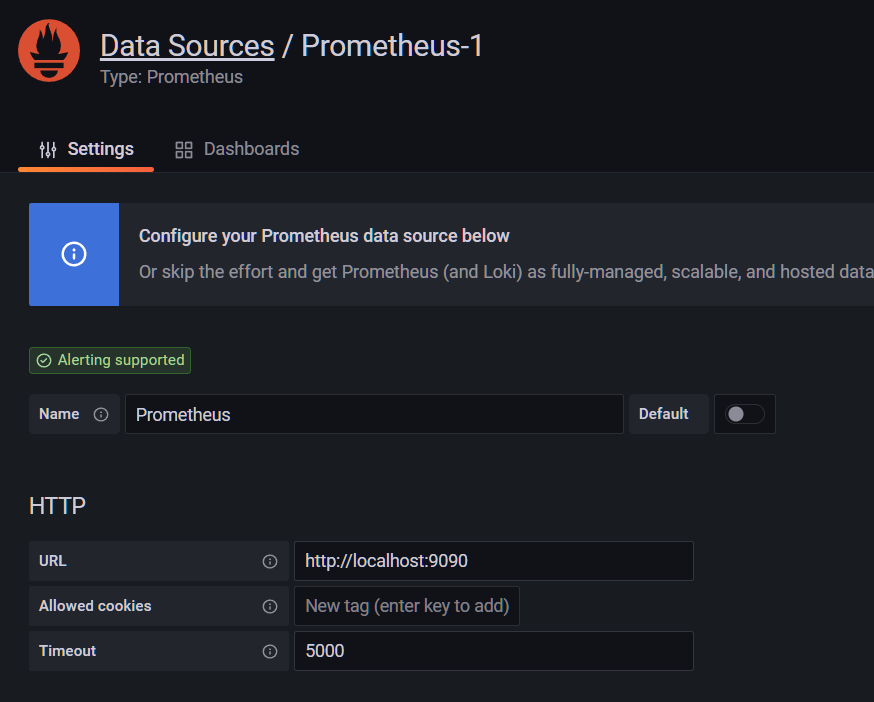
选择 prometheus 类型 填写 prometheus 地址与超时时间 然后点击下方保存
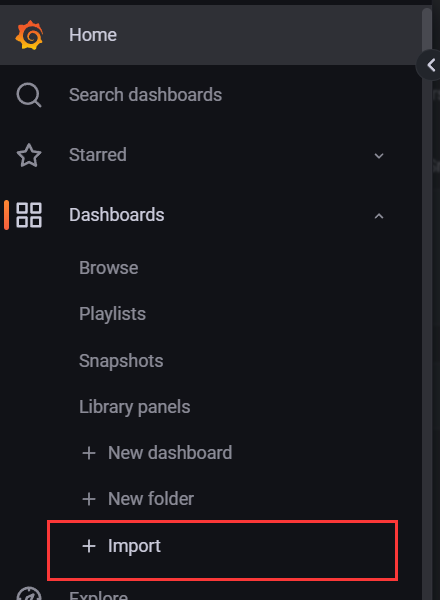
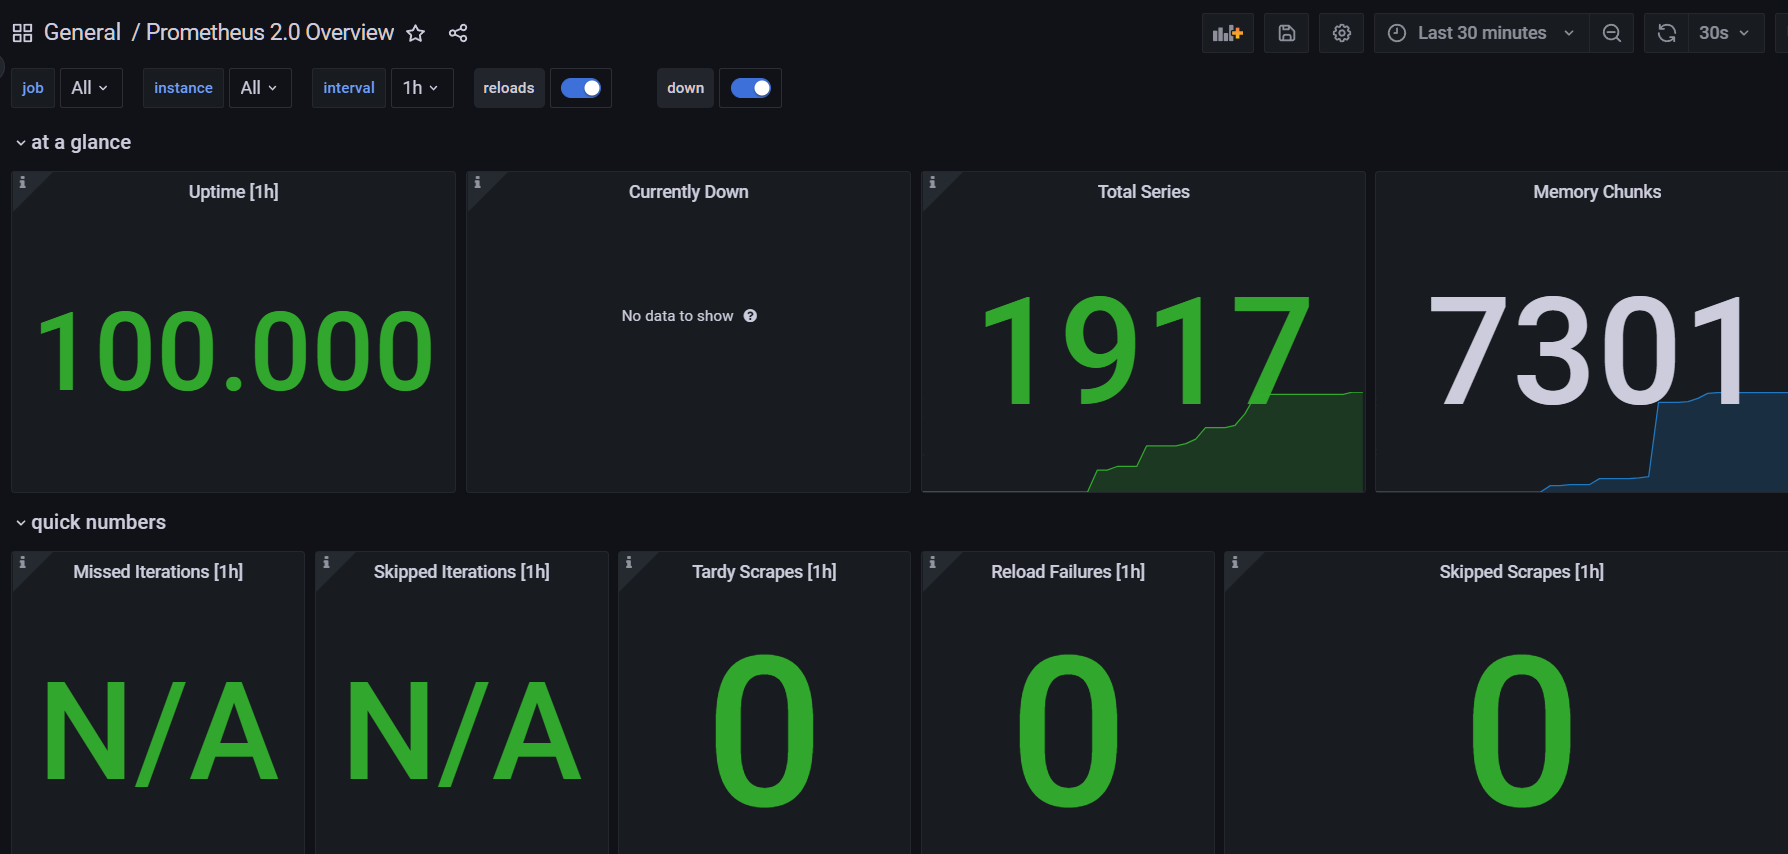
配置监控页面
进入 Grafana 官方 监控模板仓库 在这里可以找到各式各样的监控模板
https://grafana.com/grafana/dashboards/
搜索框输入 prometheus 往下翻找到 Prometheus 2.0 Overview 这个模板
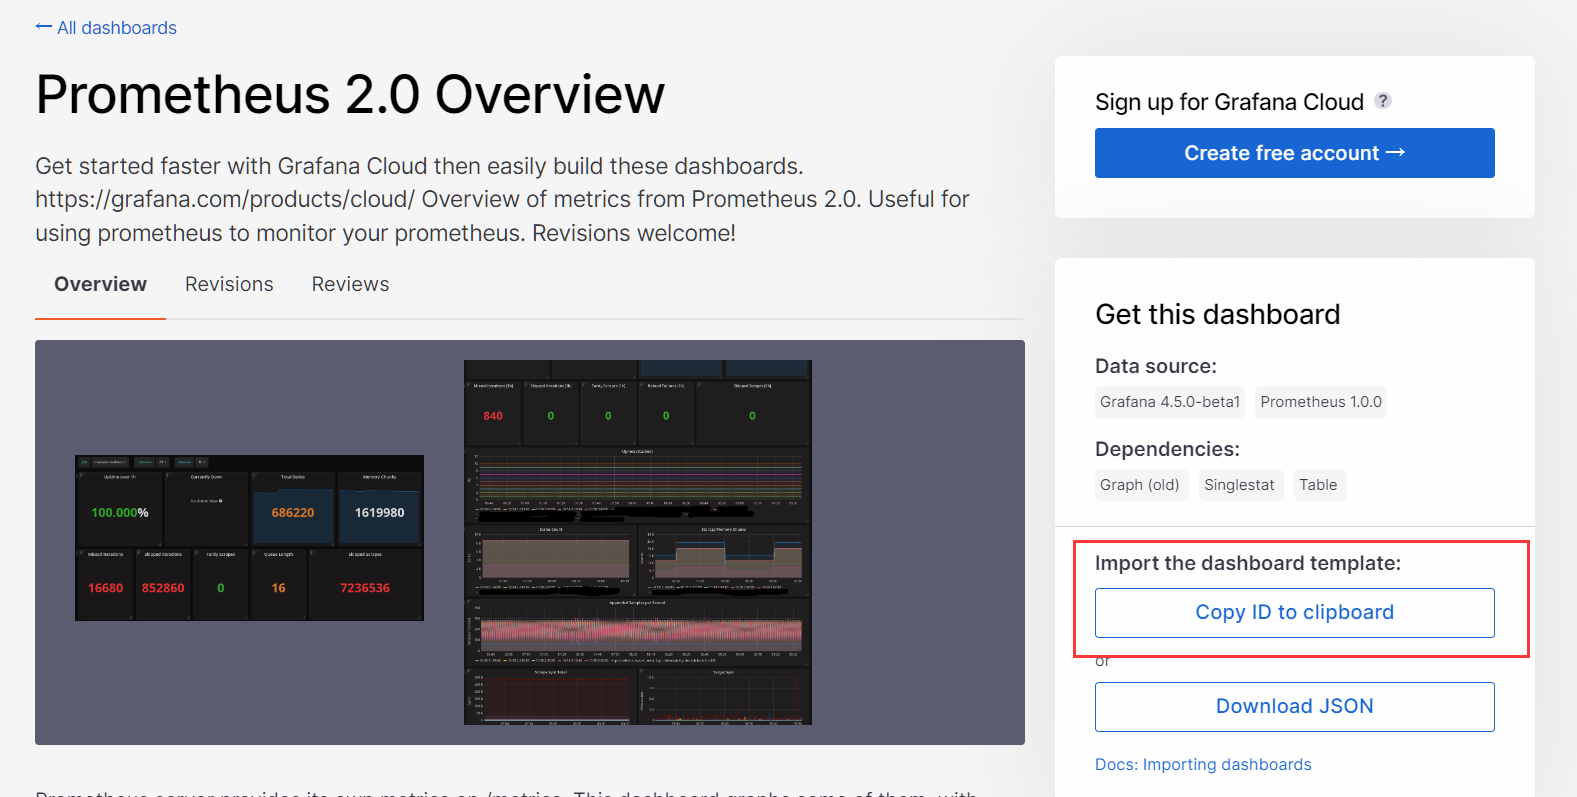
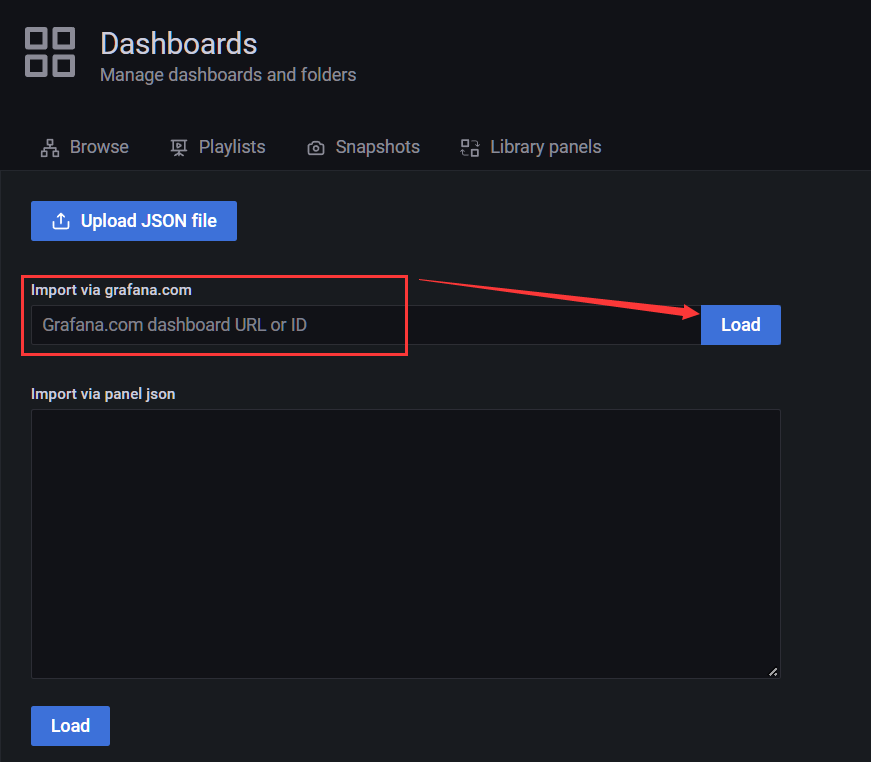
点击右侧 copy ID 这里ID为 3662 然后回到 Grafana 控制台
点击右侧菜单 Dashboards -> Import
输入刚才复制的 模板ID 点击 Load 下载模板
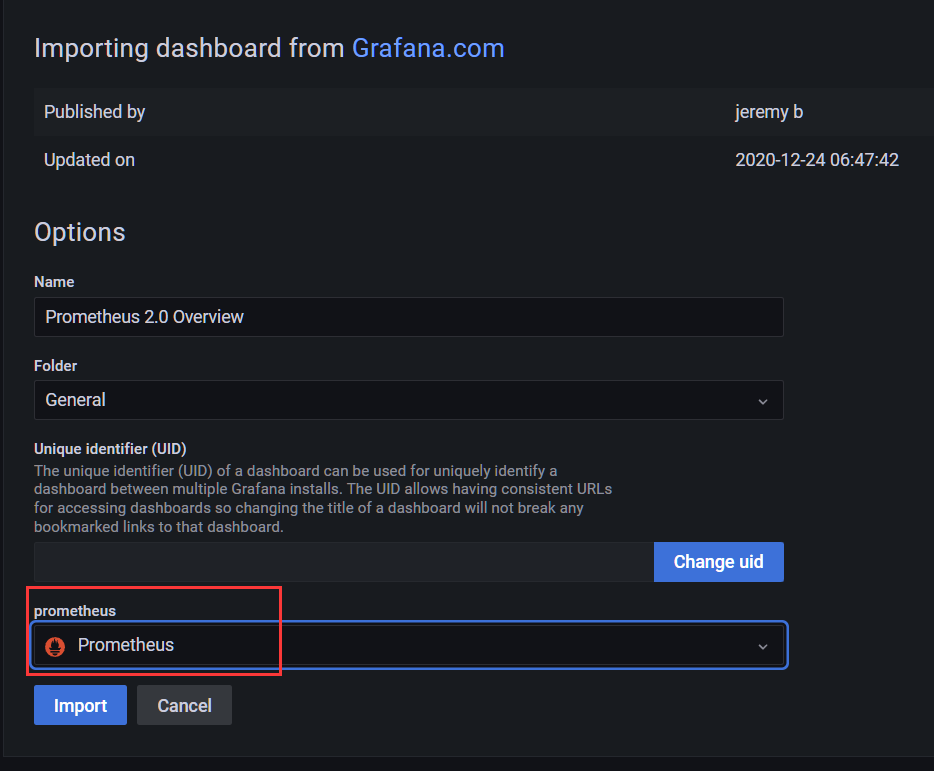
选择我们配置好的 prometheus 数据源 点击下方导入 即可完成模板的配置导入
附件
##################### Grafana Configuration Example #####################
#
# Everything has defaults so you only need to uncomment things you want to
# change# possible values : production, development
;app_mode = production# instance name, defaults to HOSTNAME environment variable value or hostname if HOSTNAME var is empty
;instance_name = ${HOSTNAME}#################################### Paths ####################################
[paths]
# Path to where grafana can store temp files, sessions, and the sqlite3 db (if that is used)
;data = /var/lib/grafana# Temporary files in `data` directory older than given duration will be removed
;temp_data_lifetime = 24h# Directory where grafana can store logs
;logs = /var/log/grafana# Directory where grafana will automatically scan and look for plugins
;plugins = /var/lib/grafana/plugins# folder that contains provisioning config files that grafana will apply on startup and while running.
;provisioning = conf/provisioning#################################### Server ####################################
[server]
# Protocol (http, https, h2, socket)
;protocol = http# The ip address to bind to, empty will bind to all interfaces
;http_addr =# The http port to use
;http_port = 3000# The public facing domain name used to access grafana from a browser
;domain = localhost# Redirect to correct domain if host header does not match domain
# Prevents DNS rebinding attacks
;enforce_domain = false# The full public facing url you use in browser, used for redirects and emails
# If you use reverse proxy and sub path specify full url (with sub path)
;root_url = %(protocol)s://%(domain)s:%(http_port)s/# Serve Grafana from subpath specified in `root_url` setting. By default it is set to `false` for compatibility reasons.
;serve_from_sub_path = false# Log web requests
;router_logging = false# the path relative working path
;static_root_path = public# enable gzip
;enable_gzip = false# https certs & key file
;cert_file =
;cert_key =# Unix socket path
;socket =#################################### Database ####################################
[database]
# You can configure the database connection by specifying type, host, name, user and password
# as separate properties or as on string using the url properties.# Either "mysql", "postgres" or "sqlite3", it's your choice
;type = sqlite3
;host = 127.0.0.1:3306
;name = grafana
;user = root
# If the password contains # or ; you have to wrap it with triple quotes. Ex """#password;"""
;password =# Use either URL or the previous fields to configure the database
# Example: mysql://user:secret@host:port/database
;url =# For "postgres" only, either "disable", "require" or "verify-full"
;ssl_mode = disable;ca_cert_path =
;client_key_path =
;client_cert_path =
;server_cert_name =# For "sqlite3" only, path relative to data_path setting
;path = grafana.db# Max idle conn setting default is 2
;max_idle_conn = 2# Max conn setting default is 0 (mean not set)
;max_open_conn =# Connection Max Lifetime default is 14400 (means 14400 seconds or 4 hours)
;conn_max_lifetime = 14400# Set to true to log the sql calls and execution times.
;log_queries =# For "sqlite3" only. cache mode setting used for connecting to the database. (private, shared)
;cache_mode = private#################################### Cache server #############################
[remote_cache]
# Either "redis", "memcached" or "database" default is "database"
;type = database# cache connectionstring options
# database: will use Grafana primary database.
# redis: config like redis server e.g. `addr=127.0.0.1:6379,pool_size=100,db=0,ssl=false`. Only addr is required. ssl may be 'true', 'false', or 'insecure'.
# memcache: 127.0.0.1:11211
;connstr =#################################### Data proxy ###########################
[dataproxy]# This enables data proxy logging, default is false
;logging = false# How long the data proxy waits before timing out, default is 30 seconds.
# This setting also applies to core backend HTTP data sources where query requests use an HTTP client with timeout set.
;timeout = 30# How many seconds the data proxy waits before sending a keepalive probe request.
;keep_alive_seconds = 30# How many seconds the data proxy waits for a successful TLS Handshake before timing out.
;tls_handshake_timeout_seconds = 10# How many seconds the data proxy will wait for a server's first response headers after
# fully writing the request headers if the request has an "Expect: 100-continue"
# header. A value of 0 will result in the body being sent immediately, without
# waiting for the server to approve.
;expect_continue_timeout_seconds = 1# The maximum number of idle connections that Grafana will keep alive.
;max_idle_connections = 100# How many seconds the data proxy keeps an idle connection open before timing out.
;idle_conn_timeout_seconds = 90# If enabled and user is not anonymous, data proxy will add X-Grafana-User header with username into the request, default is false.
;send_user_header = false#################################### Analytics ####################################
[analytics]
# Server reporting, sends usage counters to stats.grafana.org every 24 hours.
# No ip addresses are being tracked, only simple counters to track
# running instances, dashboard and error counts. It is very helpful to us.
# Change this option to false to disable reporting.
;reporting_enabled = true# Set to false to disable all checks to https://grafana.net
# for new versions (grafana itself and plugins), check is used
# in some UI views to notify that grafana or plugin update exists
# This option does not cause any auto updates, nor send any information
# only a GET request to http://grafana.com to get latest versions
;check_for_updates = true# Google Analytics universal tracking code, only enabled if you specify an id here
;google_analytics_ua_id =# Google Tag Manager ID, only enabled if you specify an id here
;google_tag_manager_id =#################################### Security ####################################
[security]
# disable creation of admin user on first start of grafana
;disable_initial_admin_creation = false# default admin user, created on startup
;admin_user = admin# default admin password, can be changed before first start of grafana, or in profile settings
;admin_password = admin# used for signing
;secret_key = SW2YcwTIb9zpOOhoPsMm# disable gravatar profile images
;disable_gravatar = false# data source proxy whitelist (ip_or_domain:port separated by spaces)
;data_source_proxy_whitelist =# disable protection against brute force login attempts
;disable_brute_force_login_protection = false# set to true if you host Grafana behind HTTPS. default is false.
;cookie_secure = false# set cookie SameSite attribute. defaults to `lax`. can be set to "lax", "strict", "none" and "disabled"
;cookie_samesite = lax# set to true if you want to allow browsers to render Grafana in a ,