
R语言对回归模型进行协方差分析
创始人
2024-04-21 14:19:20
目录
怎么做测试
协方差分析
拟合线的简单图解
模型的p值和R平方
检查模型的假设
具有三类和II型平方和的协方差示例分析
协方差分析
拟合线的简单图解
组合模型的p值和R平方
检查模型的假设
怎么做测试
具有两个类别和II型平方和的协方差示例的分析
本示例使用II型平方和 。参数估计值在R中的计算方式不同,
Data = read.table(textConnection(Input),header=TRUE)
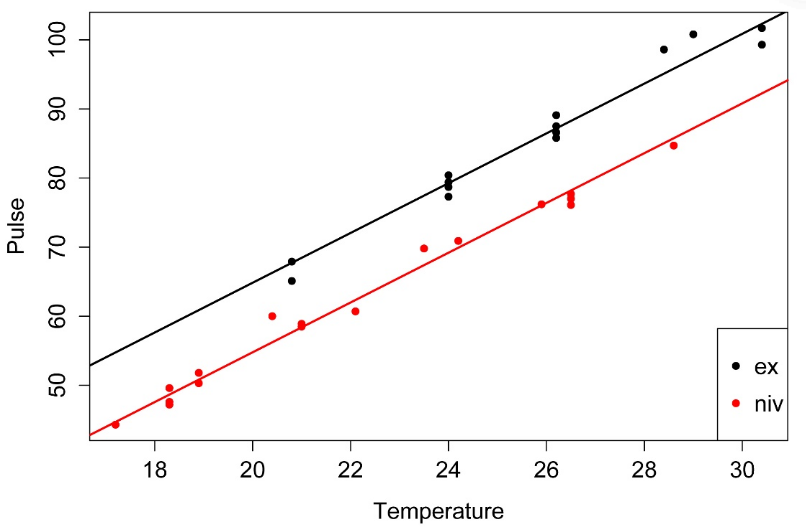
plot(x = Data$Temp, y = Data$Pulse, col = Data$Species, pch = 16,xlab = "Temperature",ylab = "Pulse")legend('bottomright', legend = levels(Data$Species), col = 1:2, cex = 1, pch = 16)协方差分析
Anova Table (Type II tests)Sum Sq Df F value Pr(>F) Temp 4376.1 1 1388.839 < 2.2e-16 ***Species 598.0 1 189.789 9.907e-14 ***Temp:Species 4.3 1 1.357 0.2542 ### Interaction is not significant, so the slope across groups### is not different. model.2 = lm (Pulse ~ Temp + Species,data = Data)library(car)Anova(model.2, type="II")Anova Table (Type II tests)Sum Sq Df F value Pr(>F) Temp 4376.1 1 1371.4 < 2.2e-16 ***Species 598.0 1 187.4 6.272e-14 ***### The category variable (Species) is significant,### so the intercepts among groups are differentCoefficients:Estimate Std. Error t value Pr(>|t|) (Intercept) -7.21091 2.55094 -2.827 0.00858 **Temp 3.60275 0.09729 37.032 < 2e-16 ***Speciesniv -10.06529 0.73526 -13.689 6.27e-14 ***### but the calculated results will be identical.### The slope estimate is the same.### The intercept for species 1 (ex) is (intercept).### The intercept for species 2 (niv) is (intercept) + Speciesniv.### This is determined from the contrast coding of the Species### variable shown below, and the fact that Speciesniv is shown in### coefficient table above.nivex 0niv 1拟合线的简单图解
plot(x = Data$Temp, y = Data$Pulse, col = Data$Species, pch = 16,xlab = "Temperature",ylab = "Pulse")
模型的p值和R平方
Multiple R-squared: 0.9896, Adjusted R-squared: 0.9888F-statistic: 1331 on 2 and 28 DF, p-value: < 2.2e-16检查模型的假设
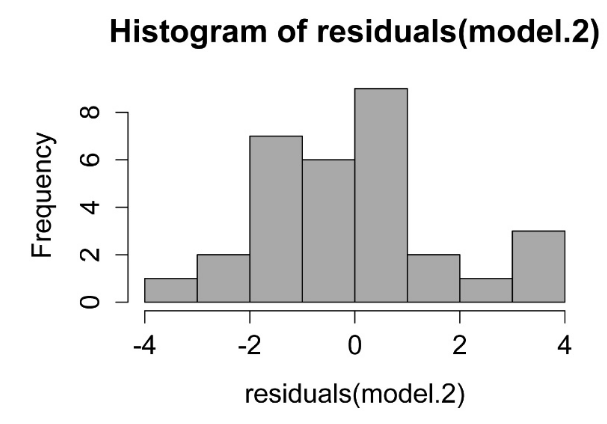
线性模型中残差的直方图。这些残差的分布应近似正态。
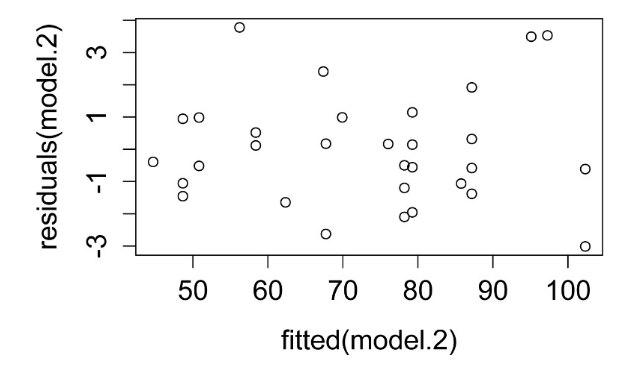
残差与预测值的关系图。残差应无偏且均等。
### additional model checking plots with: plot(model.2)
### alternative: library(FSA); residPlot(model.2)
具有三类和II型平方和的协方差示例分析
本示例使用II型平方和,并考虑具有三个组的情况。
### --------------------------------------------------------------
### Analysis of covariance, hypothetical data
### --------------------------------------------------------------Data = read.table(textConnection(Input),header=TRUE)
plot(x = Data$Temp, y = Data$Pulse, col = Data$Species, pch = 16,xlab = "Temperature",ylab = "Pulse")legend('bottomright', legend = levels(Data$Species), col = 1:3, cex = 1, pch = 16)协方差分析
options(contrasts = c("contr.treatment", "contr.poly"))### These are the default contrasts in RAnova(model.1, type="II")Sum Sq Df F value Pr(>F) Temp 7026.0 1 2452.4187 <2e-16 ***Species 7835.7 2 1367.5377 <2e-16 ***Temp:Species 5.2 2 0.9126 0.4093 ### Interaction is not significant, so the slope among groups### is not different. Anova(model.2, type="II")Sum Sq Df F value Pr(>F) Temp 7026.0 1 2462.2 < 2.2e-16 ***Species 7835.7 2 1373.0 < 2.2e-16 ***Residuals 125.6 44 ### The category variable (Species) is significant,### so the intercepts among groups are differentsummary(model.2)Coefficients:Estimate Std. Error t value Pr(>|t|) (Intercept) -6.35729 1.90713 -3.333 0.00175 **Temp 3.56961 0.07194 49.621 < 2e-16 ***Speciesfake 19.81429 0.66333 29.871 < 2e-16 ***Speciesniv -10.18571 0.66333 -15.355 < 2e-16 ***### The slope estimate is the Temp coefficient.### The intercept for species 1 (ex) is (intercept).### The intercept for species 2 (fake) is (intercept) + Speciesfake.### The intercept for species 3 (niv) is (intercept) + Speciesniv.### This is determined from the contrast coding of the Species### variable shown below.contrasts(Data$Species)fake nivex 0 0fake 1 0niv 0 1拟合线的简单图解

组合模型的p值和R平方
Multiple R-squared: 0.9919, Adjusted R-squared: 0.9913F-statistic: 1791 on 3 and 44 DF, p-value: < 2.2e-16检查模型的假设
hist(residuals(model.2), col="darkgray") 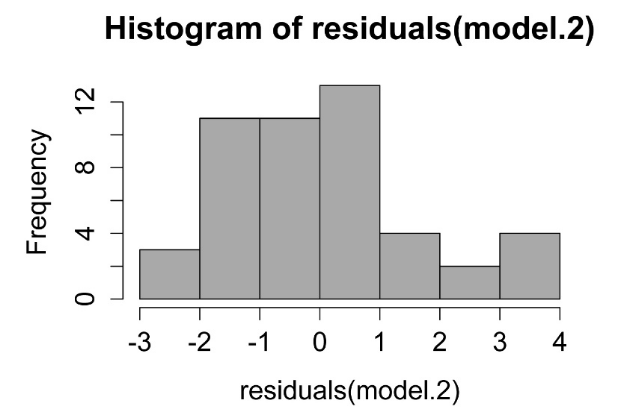
线性模型中残差的直方图。这些残差的分布应近似正态。
plot(fitted(model.2), residuals(model.2)) 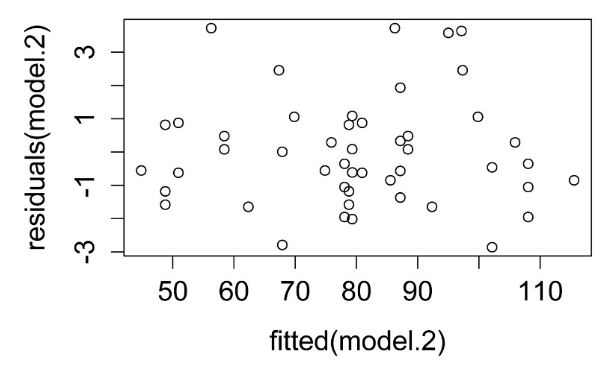
残差与预测值的关系图。残差应无偏且均等。
 ### additional model checking plots with: plot(model.2)
### alternative: library(FSA); residPlot(model.2) 相关内容
热门资讯
埃菲尔铁塔在哪 中国仿建埃菲尔...
2019年4月26日,广西南宁市,街头惊现一座巨型山寨版埃菲尔铁塔,高约20米,白色塔身,造型逼真,...
苗族的传统节日 贵州苗族节日有...
【岜沙苗族芦笙节】岜沙,苗语叫“分送”,距从江县城7.5公里,是世界上最崇拜树木并以树为神的枪手部落...
北京的名胜古迹 北京最著名的景...
北京从元代开始,逐渐走上帝国首都的道路,先是成为大辽朝五大首都之一的南京城,随着金灭辽,金代从海陵王...
长白山自助游攻略 吉林长白山游...
昨天介绍了西坡的景点详细请看链接:一个人的旅行,据说能看到长白山天池全凭运气,您的运气如何?今日介绍...
应用未安装解决办法 平板应用未...
---IT小技术,每天Get一个小技能!一、前言描述苹果IPad2居然不能安装怎么办?与此IPad不...
脚上的穴位图 脚面经络图对应的...
人体穴位作用图解大全更清晰直观的标注了各个人体穴位的作用,包括头部穴位图、胸部穴位图、背部穴位图、胳...
猫咪吃了塑料袋怎么办 猫咪误食...
你知道吗?塑料袋放久了会长猫哦!要说猫咪对塑料袋的喜爱程度完完全全可以媲美纸箱家里只要一有塑料袋的响...
demo什么意思 demo版本...
618快到了,各位的小金库大概也在准备开闸放水了吧。没有小金库的,也该向老婆撒娇卖萌服个软了,一切只...
世界上最漂亮的人 世界上最漂亮...
此前在某网上,选出了全球265万颜值姣好的女性。从这些数量庞大的女性群体中,人们投票选出了心目中最美...
埃菲尔铁塔在哪 中国仿建埃菲尔...
2019年4月26日,广西南宁市,街头惊现一座巨型山寨版埃菲尔铁塔,高约20米,白色塔身,造型逼真,...
苗族的传统节日 贵州苗族节日有...
【岜沙苗族芦笙节】岜沙,苗语叫“分送”,距从江县城7.5公里,是世界上最崇拜树木并以树为神的枪手部落...
北京的名胜古迹 北京最著名的景...
北京从元代开始,逐渐走上帝国首都的道路,先是成为大辽朝五大首都之一的南京城,随着金灭辽,金代从海陵王...
长白山自助游攻略 吉林长白山游...
昨天介绍了西坡的景点详细请看链接:一个人的旅行,据说能看到长白山天池全凭运气,您的运气如何?今日介绍...
世界上最漂亮的人 世界上最漂亮...
此前在某网上,选出了全球265万颜值姣好的女性。从这些数量庞大的女性群体中,人们投票选出了心目中最美...
应用未安装解决办法 平板应用未...
---IT小技术,每天Get一个小技能!一、前言描述苹果IPad2居然不能安装怎么办?与此IPad不...
脚上的穴位图 脚面经络图对应的...
人体穴位作用图解大全更清晰直观的标注了各个人体穴位的作用,包括头部穴位图、胸部穴位图、背部穴位图、胳...
demo什么意思 demo版本...
618快到了,各位的小金库大概也在准备开闸放水了吧。没有小金库的,也该向老婆撒娇卖萌服个软了,一切只...
猫咪吃了塑料袋怎么办 猫咪误食...
你知道吗?塑料袋放久了会长猫哦!要说猫咪对塑料袋的喜爱程度完完全全可以媲美纸箱家里只要一有塑料袋的响...